Profiling data in PowerPivot: comparing two tables
November 5, 2012 Leave a comment
On a prior post, I described the process in which one could use PowerPivot to find duplicates when exploring a dataset. Another common scenario when first diving into new data is finding common records across two different tables.
Level: Easy
Problem: You have two datasets and want to compare attribute values across them. In concrete terms, you want to understand if a particular key value is present in the other dataset or not.
Relevancy: Comparing datasets is a common issue when modeling solutions in PowerPivot or BISM Tabular, as you must determine which table can and should be used as a lookup in your model. For lookup tables to be valid dimensions, they must contain all members across tables and only contain unique values on the key column. The process of comparing tables can assist you with selecting the appropriate table to use as lookup.
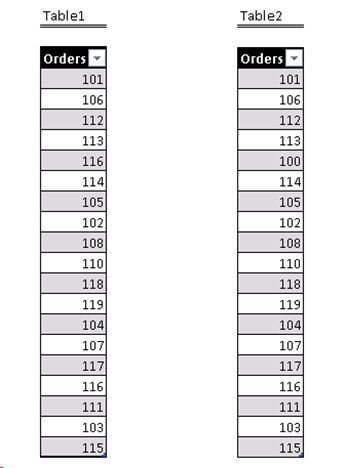
Scenario: The following tables where sent to you as lists of orders. You want to know which table includes all orders.
Solution
One important test is to verify how many unique records are on each table. This will allow us to quickly understand if there are duplicates on either one.
For this, two DAX measures can be used (two for each table):
CountRowsTable1:=COUNTROWS(Table1)
DistinctCountOrdersTable1:=DISTINCTCOUNT(Table1[Orders])
CountRowsTable2:=COUNTROWS(Table2)
DistinctCountOrdersTable2:=DISTINCTCOUNT(Table2[Orders])
Here are the results:
Table1
Table2
We now see there appears to be a duplicate value on Table1. We can now use two calculated columns (one each table) to further investigate:
TABLE 1
=CALCULATE( COUNTROWS( Table2 ),
FILTER( Table2, Table2[Orders] = Table1[Orders] ) )
TABLE 2
=CALCULATE( COUNTROWS( Table1 ),
FILTER( Table1, Table1[Orders] = Table2[Orders] ) )
This calculation counts the rows on the other table, but only those rows that survived the filter applied: an equality condition based on the Order number in the current row context.
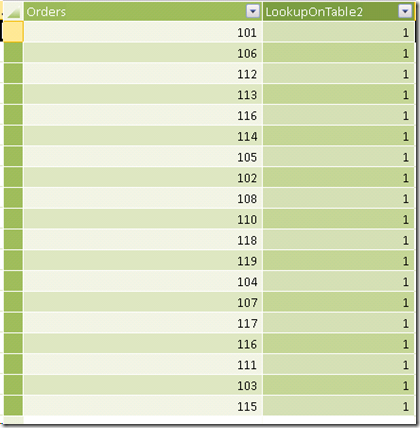
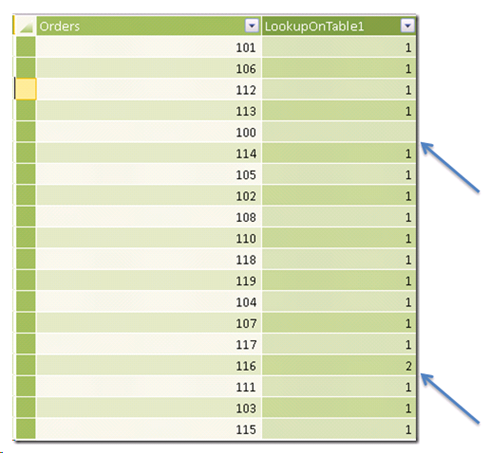
With these results we can now see all values on Table1 are represented on Table2. However, looking at the results on Table2 we see one value is not represented on Table1: Order # 100. Not only that, but Order # 116 appears twice.
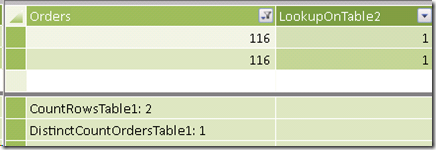
If we switch back to Table1 in the PowerPivot window, we can confirm this by filtering the column:
With this knowledge we can now be certain to select Table2 as our lookup (dimension equivalent) in the model, as it is the only one that has a comprehensive list of all order values and only unique entries.
In case neither table had a full list or order values, other techniques like the ones described here, here or here could be the applied to the same data in order to develop a valid PowerPivot (or BISM Tabular) lookup table, and in turn, a maintainable model.


