Merging data in PowerPivot
July 28, 2012 9 Comments
Update 9/23/13: Check an example using Power Query to deal with the same issue described on this article: https://javierguillen.wordpress.com/2013/09/23/target-well-formed-data-models-when-using-power-query/
One of the most common requests I have seen from data analysts working with PowerPivot is how to merge two or more datasets. For example, you are given the following two sales extracts and are asked then to generate a YTD report based on their composite data
Extract 1 (Table 1):
Extract 2 data (Table 2):
If we want to report on total amount for the year, we must combine these two files. How do we do this?
Somebody new to PowerPivot may be tempted to add a relationship between those two tables on the common key column (Product ID). However, when attempting this, PowerPivot will return an error:
PowerPivot complains that there are duplicate values, which indeed there are (on both tables, Product ID has multiple values that are the same). Here is one clue: if you examine the relationship window closely you will notice that one table is a ‘lookup’ whereas the other one is not:
For this lookup table, we want unique values, as there is no point on having a lookup table that would resolve in more than one value. Why is that? Imagine you have the following tables:
Notice how there was a sales amount for 1/1/2012 for the city of Bogota. If we wanted to report on the sales figures by Country, which country should we use from the look up table? (there are two different matches for the same city name so PowerPivot couldn’t logically resolve this relationship).
So the rule for PowerPivot lookup tables is that the field in which we join must have unique values (no duplicates allowed).
Let’s go back to our example. How are we going to merge the tables if we have no valid ‘lookup’? Here is where the world of ‘self-service BI’ comes to life: if we don’t have the table we need, we can create our own! This effort is what is referred to as data modeling, as you are organizing the structure of the data as it resides inside PowerPivot.
I will walk through the example in two different scenarios, fixing the data right in the spreadsheet or relying on an underlying relational database (you can find the database scenario on the following blog entry available here).
Worksheet only example
Ever wonder if there was a way to give Excel a list of values containing duplicates and have it remove those annoying ‘dups’ automatically? Well, such a button exists in the Excel ribbon indeed and is called – not mysteriously – ‘Remove duplicates’:
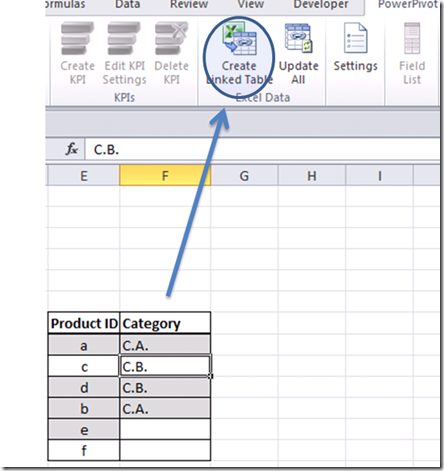
Let’s use it to create our lookup. As we want to join by Product ID, our lookup will be a Product table. Notice also we have Product Categories in one of the tables, and it is always a good practice to encapsulate all related attributes in one logical grouping, hence those category names should go into this new table as well.
Copy and paste the Product ID and Category from ‘Table 2’ somewhere into the worksheet (including headers). Then copy and paste the Product ID values from ‘Table 1’ below the last value. Now, highlight the values and click on the ‘remove duplicates’ option in the ribbon. Select only the ‘Product ID’ column:
You can now import the resulting table into the PowerPivot model:
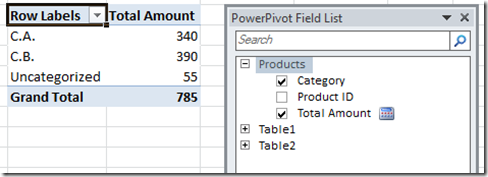
For usability, I created a calculated column that shows the value “uncategorized” whenever the product didn’t belong to a category, and then I hid the imported ‘Category’ column:
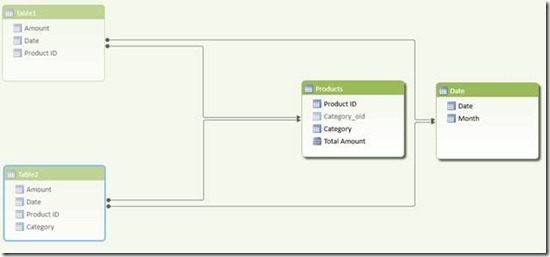
Now we can join both initial tables to our custom lookup and PowerPivot will be happy. If you notice, we have gotten closer to the creation of a star schema. This is interesting to notice, as advanced data analysts will quite literally engage in testing data models as they produce reports — data models than I.T. can then qualify for upgrade to full blown SSAS BISM Tabular models (with the added advantage that they will be already ‘tested’ by subject matter experts).
Anyhow, here is how our new data model looks like in the PowerPivot design window:
We can now test our data model in a pivot table:
Notice we still have two ‘Amount’ fields. We must consolidate them into one. That is pretty simple to do, by creating a new DAX measure:
Now we can remove the other two measures and leave only this [Total Amount] measure. The resulting pivot table will have successfully merged the amounts from the two monthly extracts:
We can now execute the same logic and create a second lookup table that will allow us to slice by date or month. Following the same technique, we arrive at this data model:
I added a DAX calculated column to the new lookup which shows the month name for each date and hid the initial extract tables in order to ‘clean’ the data model and increase usability. We can now slice both tables easily and create an interesting report:
I added a DAX year to date measure:
YTD:=TOTALYTD( [Total Amount], ‘Date'[Date] )
plus a pivot table and a pivot chart. With this, it is now easy to see:
* the best performer (category “C.A.” on Jan),
* the worst (non-categorized products on Feb) and
* category “C.B.” is growing at a pace that is outperforming the others.
Very powerful analysis is easy to achieve when understanding the rules under which the PowerPivot engine operates!


Javier,
I am sure this is easy, but I do not know how to do it. Instead of the two lookups, I put the two months (Feb and Mar) into one table. Now I want to find out what was added and deleted from Feb to Mar. Say the data look like this:
Program, Month
1, Feb
2, Feb
3, Feb
1, Mar
3, Mar
4, Mar
I know how to get the additions and deletions if I have the months in separate tables, but I get stuck when I have them in one. Could you please give me some pointers?
Thanks
Hi SF
Are you trying to compute ‘returning customers’ (programs)? This sounds similar to what Chris Webb blogged about here: http://cwebbbi.wordpress.com/2010/05/03/counting-returning-customers-in-dax/
Hi Javier,
I am not quite sure if the “returning customers’ scenario applies. Maybe, but I am not sure. I think I need a self-join on the table, but I may be wrong about that. I know enough SQL to be dangerous.
Here is an example of the type of output I want to get (substitute “State” for “Program” in the my previous entry):
State, FebTotal, Deletions, Additions, MarTotal
AK, 1, 1, 0, 0
AL, 10, 4, 3, 9
AR, 0, 0, 3, 3
etc.
I can easily get the Feb and March totals, but the deletions and additions are derived. To get them I need to compare the list from Feb and the list from Mar, which is why I think I need a self-join on the ALL table, but I understand PowerPivot does not do self-joins. On the other hand, maybe I am making this too hard.
Right now, I have a kluged up solution with multiple tables. The individual tables by month joined to a table with distinct ID values then the ALL table with all data. I create calculated columns in the tables to get the additions and deletions. I feel that I should be able to just use the ALL table to get the additions and deletions, rather than using multiple tables, but I do not know how.
Do you think this is similar to the ‘returning customer’ scenario? I appreciate any insight you can provide.
Thanks,
SF
Pingback: Create pivot table from 2 sets of data to produce pricelists
Pingback: combining two slightly different datasets
Pingback: Stack data tables from different sources with PowerPivot
Pingback: Automate lookup table maintenance when using multiple Excel sources in a PowerPivot model « Javier Guillén
Pingback: Profiling data in PowerPivot: comparing two tables « Javier Guillén
Pingback: Target well-formed Data Models when using Power Query | Javier Guillén